

If your teen just got their license, you already know the feeling: the car pulls out of the driveway, and the house gets very quiet. The latest teen driving statistics explain why that moment carries so much weight, and they also show something more useful. Most of the risk sits inside a handful of predictable situations you can actually plan around.
Here is the short version. In 2024, the most recent full year of federal crash data, 2,899 U.S. teens ages 13 to 19 died in motor vehicle crashes, about eight a day. Per mile driven, drivers ages 16 to 19 have a fatal crash rate about three times that of drivers 20 and older. Nights, weekends, summer, teen passengers, speed, phones and skipped seat belts account for a large share of those crashes.
Below, we break down every major teen driving stat for 2026, from distracted driving and speeding to state rankings and insurance costs, and then turn the numbers into a simple plan for your family. Teen Driver Safety Week runs October 18 to 24, 2026, which makes this a good month to have the conversation.
Teen driving statistics (2024 data): 2,899 teens ages 13 to 19 died in crashes, making motor vehicle crashes the leading cause of teen death. Drivers 16 to 19 crash about 3 times as often per mile as drivers 20 and older in fatal crashes, and over 4 times as often in crashes of any severity. 73% of teens killed were male, 51% of deaths happened Friday through Sunday, and 53% of teen driving deaths happened between 6 p.m. and 3 a.m. Nearly half (46%) of high school drivers say they text or email while driving.
How we built this guide: every number below comes from a primary or research source, and we list the data year next to it so you always know how current it is.
Teen Driving Statistics at a Glance (2026 Update)
If you only have a minute, this table covers the teen driving stats that matter most. Each row links back to the section where we explain it.
| Statistic | Latest figure | Data year | Source |
|---|---|---|---|
| Teens (13-19) killed in motor vehicle crashes | 2,899 (about 8 per day) | 2024 | IIHS / NHTSA FARS |
| Teen motor vehicle occupant deaths | 2,565, down 5.4% from 2023 | 2024 | NSC / NHTSA |
| People killed in crashes involving a young driver (15-20) | 5,247, down 6.5% from 2023 | 2024 | NSC / NHTSA |
| Fatal crash rate per mile, drivers 16-19 vs. 20+ | About 3x higher | 2022 mileage | IIHS |
| Crash rate (all severities) per mile, 16-19 vs. 20+ | Over 4x higher | 2022 mileage | IIHS |
| Share of teen crash deaths who were male | 73% | 2024 | IIHS |
| Teen drivers in fatal crashes reported as distracted | 7% (241 drivers) | 2024 | NHTSA |
| Teen crashes where video showed distraction | 58% of moderate-to-severe crashes | Video study | AAA Foundation |
| High school drivers who text or email while driving | 46% | 2025 | CDC YRBS |
| Teen driving deaths between 6 p.m. and 3 a.m. | 53% | 2024 | IIHS |
| Fatally injured drivers 16-19 with alcohol in their system | 34% | 2024 | IIHS |
| Teen crash deaths on Friday, Saturday or Sunday | 51% | 2024 | IIHS |
| Drop in teen crash deaths since graduated licensing began | 50% (1996 to 2024) | 2024 | IIHS |
FARS = NHTSA's Fatality Analysis Reporting System, the national census of fatal crashes.
Why "2026" statistics use 2024 crash data
Federal fatal crash data takes time to verify. NHTSA's final 2024 file was published in 2026, so any article promising "2026 teen driving statistics" is really reporting 2024 crashes. That is the newest complete national data available, and it is what we use here.
You will also see different totals across websites because sources define "teen" differently. IIHS and the CDC usually mean ages 13 to 19. NHTSA uses 15 to 19 for some reports, 15 to 20 ("young drivers") for others, and 15 to 18 for Teen Driver Safety Week materials. None of these numbers are wrong. They are just counting slightly different groups, so always check the age range.
How Dangerous Is Teen Driving? Crash Risk by Age
Teens drive fewer miles than almost any other age group, yet they show up in crash data far more often than their mileage would predict. That gap is the whole story behind teen car insurance prices, graduated licensing laws, and the knot in a parent's stomach.
Teen crash rates per mile vs. older drivers
IIHS combines federal crash data with National Household Travel Survey mileage to compare risk fairly. Here is how fatal crash involvement per 100 million miles driven breaks down by age.
| Driver age | Fatal crash involvements per 100M miles | Male | Female |
|---|---|---|---|
| 16-19 | 7.5 | 9.2 | 5.2 |
| 20-29 | 5.1 | 7.0 | 3.2 |
| 30-59 | 1.9 | 2.2 | 1.4 |
| 60-69 | 1.6 | 1.7 | 1.4 |
| 70+ | 3.0 | 2.9 | 3.4 |
Source: IIHS Fatality Facts 2024: Teenagers, using 2022 National Household Travel Survey mileage.
Put simply, a teen driver is roughly four times as likely as a driver in their 30s, 40s or 50s to be in a fatal crash for every mile they drive. When you count crashes of all severities, IIHS puts the teen rate at more than four times that of drivers 20 and older.
The first months with a license are the riskiest
Crash risk is highest at ages 16 and 17 and is especially high in the first months after a teen gets their license, according to IIHS and the CDC. Inexperience is the main driver. New drivers are still learning to scan for hazards, judge speed on curves and react quickly when traffic changes.
The practical takeaway: the first 6 to 12 months of solo driving deserve the most structure. That is when house rules and check-ins do the most good.
Teen driving stats by gender
About 3 of every 4 teens killed in crashes in 2024 were male (2,106 of 2,899). Per mile driven, male drivers 16 to 19 had a fatal crash rate of 9.2 per 100 million miles, compared with 5.2 for female drivers the same age.
Male teens killed in crashes are also more likely to have been drinking. Among fatally injured drivers ages 18 to 19, IIHS estimates 37% of males had a blood alcohol concentration (BAC) of 0.08% or higher, compared with 25% of females.
Teens are rarely the only people hurt
In 2024, 5,247 people died in crashes involving at least one driver ages 15 to 20, and the young drivers themselves were only about 41% of those deaths, according to the National Safety Council. The rest were passengers, people in other cars, pedestrians and cyclists. Also, 58% of teen passengers who died were riding in a car driven by another teenager.
Teen Distracted Driving Statistics
Distraction is the teen driving stat that confuses people most, because official crash reports and video research tell very different stories. Both are worth knowing.
What official 2024 crash reports show
NHTSA's 2024 data sheet on teens (ages 15 to 19) and distracted driving reports:
- 3,208 people of all ages were killed in distraction-affected crashes in 2024.
- 241 teen drivers in fatal crashes were distracted, 7% of the 3,667 teen drivers involved in fatal crashes.
- 264 people died in crashes involving a distracted teen driver, and 47% of them were teens.
- Teens are 8% of all distracted drivers in fatal crashes, and NHTSA notes drivers 15 to 20 are overrepresented among distracted drivers relative to their share of all drivers in fatal crashes.
What in-car video shows: distraction in 58% of teen crashes
The AAA Foundation for Traffic Safety studied nearly 1,700 videos from in-car cameras that captured the six seconds before real teen crashes. Distraction was a factor in 58% of moderate-to-severe crashes. That is about four times higher than estimates based on police reports.
The video numbers were even more striking for specific crash types. Distraction showed up in 89% of road-departure crashes and 76% of rear-end crashes. Teens handling a phone had their eyes off the road for an average of 4.1 of the final 6 seconds before impact.
The most common teen driver distractions (AAA Foundation video study)
| Distraction before the crash | Share of teen crashes |
|---|---|
| Talking or interacting with passengers | 15% |
| Cell phone use (calling, texting, reading) | 12% |
| Looking at something inside the car | 10% |
| Looking at something outside the car | 9% |
| Singing or moving to music | 8% |
| Grooming | 6% |
| Reaching for an object | 6% |
Notice that passengers top the list, not phones. That lines up with the passenger data later in this article and is one reason graduated licensing laws limit teen passengers.
Texting while driving: new 2025 CDC data
The CDC's Youth Risk Behavior Survey, released in September 2026, found that 46% of high school students who drove in the past 30 days texted or emailed while driving. That is up from 42% in 2023, though the CDC describes the change as not statistically significant. Students in rural schools were more likely to text or email while driving than students in urban schools.
NHTSA's rule of thumb still applies: reading or sending a text takes your eyes off the road for about 5 seconds. At 55 mph, that is like driving the length of a football field blindfolded.
Why police reports undercount distraction
Officers usually have to rely on what drivers admit or what witnesses saw. Few people volunteer that they were reading a text, and a crash can destroy the evidence. That is why NHTSA's official teen distraction figure (7% of teen drivers in fatal crashes) sits so far below what cameras capture (58% of moderate-to-severe crashes). The real number is almost certainly higher than police data suggests.
The Other Big Teen Driving Risk Factors
Distraction gets the headlines, but speed, passengers, night driving, seat belts and alcohol all show up again and again in teen crash data. Here are the three that matter most for most families.
Speeding
Excessive speed is a factor in almost a third of teen drivers' fatal crash involvements (IIHS). Teens also have the highest share of single-vehicle fatal crashes of any age group, 41% in 2024, usually high-speed loss-of-control crashes.
Teen passengers
A 17-year-old's risk of death per mile rises 44% with one passenger under 21 and doubles with two, per the AAA Foundation. An adult passenger 35 or older lowers the risk.
Night driving
In 2024, 35% of teen driving deaths happened between 9 p.m. and 3 a.m., and 53% between 6 p.m. and 3 a.m. (IIHS). The CDC puts the teen fatal crash rate at night at about 3x that of adults per mile.
Seat belt use
Among fatally injured passenger car drivers ages 16 to 19 in 2024, between 43% and 48% were unbelted depending on age, with belt status unknown for another 12% to 14%. Teen passengers who died were unbelted about half the time. Buckling up remains the single easiest way to survive a crash that does happen.
Alcohol and impaired driving
Even though drinking is illegal under 21, IIHS reports that 34% of fatally injured drivers ages 16 to 19 in 2024 had alcohol in their system. About 20% of fatally injured 16- and 17-year-old drivers had a BAC of 0.08% or higher, and that share has mostly been climbing since 2017. Teens are less likely than adults to drink and drive, but their crash risk rises much faster when they do.
Driver error and inexperience
IIHS notes teen crashes more often involve driver error than adult crashes. Common patterns include not scanning for hazards, going too fast for conditions, and overcorrecting when a tire drops off the pavement. These are skills that improve with supervised practice across different roads, weather and times of day.
When Teen Crashes Happen: Time, Day and Season
This is the most actionable part of the data for parents. Teen crash deaths are not spread evenly across the week. They cluster in specific windows, and those windows are exactly where house rules help most.
Teen crash deaths by time of day
| Time of day | Teen crash deaths (2024) | Share |
|---|---|---|
| 6 a.m. - 9 a.m. | 246 | 9% |
| 9 a.m. - noon | 190 | 7% |
| Noon - 3 p.m. | 275 | 10% |
| 3 p.m. - 6 p.m. | 386 | 13% |
| 6 p.m. - 9 p.m. | 510 | 18% |
| 9 p.m. - midnight | 527 | 18% |
| Midnight - 3 a.m. | 488 | 17% |
| 3 a.m. - 6 a.m. | 260 | 9% |
Source: IIHS Fatality Facts 2024: Teenagers (ages 13-19, all road users).
Weekends
Fifty-one percent of teen crash deaths in 2024 happened on Friday, Saturday or Sunday. Saturday alone accounted for 19%, the highest of any day, followed by Sunday at 17%.
Summer and the "100 Deadliest Days"
Teen crash deaths peaked in June in 2024, and May through September made up nearly half of the year's total. AAA calls the stretch from Memorial Day to Labor Day the "100 Deadliest Days," reporting that more than 30% of fatal crashes involving teen drivers happen in that window. From 2015 through 2024, 7,805 people died in summertime crashes involving teen drivers. School is out, teens drive more without adults, and they drive more with friends.
Teen Driving Statistics by State
Where your teen drives matters too. Using NHTSA and Federal Highway Administration data, driver education company Zutobi ranked states by teen drivers killed per 100,000 licensed teen drivers in 2024.
| Highest teen driver death rates | Rate per 100K | Lowest teen driver death rates | Rate per 100K |
|---|---|---|---|
| 1. Kentucky | 86.60 | 1. South Dakota | 7.43 |
| 2. Mississippi | 62.31 | 2. Iowa | 7.65 |
| 3. Vermont | 53.17 | 3. Utah | 12.03 |
| 4. North Carolina | 43.44 | 4. New Jersey | 12.09 |
| 5. Nevada | 41.90 | 5. Rhode Island | 12.10 |
Source: Zutobi Teen Driver Report, updated July 2026, based on 2024 NHTSA data. Small states can swing sharply year to year because a few crashes change the rate a lot.
By raw numbers, Texas (253), California (197) and Florida (140) lost the most teen drivers in 2024, which mostly reflects their large populations. New Jersey, the only state that doesn't license until age 17, consistently ranks among the safest.
Are Teen Drivers Getting Safer? The Long-Term Trend
Yes, over the long run, and by a lot. Teen crash deaths in 2024 were 67% lower than in 1975. Since 1996, when the first three-stage graduated driver licensing (GDL) program began in the U.S., teen crash deaths have fallen 50%, from 5,819 to 2,899.
The recent picture is more mixed. Teen crash deaths jumped during the pandemic years and peaked at 3,090 in 2021. The 2024 total is down from there, but it is still about 21% above the 2019 level of 2,394. Progress is real, but it has not fully returned to pre-2020 levels.
What Teen Crashes Cost Families
Teen crash risk shows up directly in your insurance bill. Insurers price policies on the likelihood of a claim, and teen drivers are the highest-risk group they cover.
- Insurance: Bankrate data from late 2025 puts the average annual cost of full coverage for a 16-year-old added to a parent's policy at about $5,740. For a married couple, adding a teen often more than doubles the premium.
- Medical and societal cost: The CDC estimates teen motor vehicle crash deaths cost about $40.7 billion in medical costs and value of lives lost in 2020 alone.
- Repairs and downtime: Even a minor fender-bender can mean deductibles, rental cars and a rate increase at renewal.
Premiums drop as teens build a clean record, and most carriers offer good-student and driver-training discounts. Some also offer discounts for safe-driving programs, so ask your agent what counts.
What the Research Says Actually Works
Statistics are only useful if they change what you do. The good news is that researchers have tested what lowers teen crash risk, and parents control more of it than most people think.
Graduated driver licensing (GDL)
Every state has some form of GDL, but the strength varies. IIHS lists current best practices as a minimum permit age of 16, at least 70 hours of supervised practice, a minimum intermediate license age of 17, and during the intermediate stage, a night driving limit starting at 8 p.m. plus a ban on teen passengers. Raising the licensing age from 16 to 17 is linked to a 13% lower fatal crash rate among 15- to 17-year-olds.
Even if your state's law is weaker, you can adopt the stronger version as a family rule.
Parent involvement and a parent-teen driving agreement
IIHS research suggests the quality of supervised practice matters even more than the hours. Mix in highways, rain, night driving and unfamiliar routes while you are still in the passenger seat. Then put your expectations in writing with a simple parent-teen driving agreement covering curfew, passengers, phones, speed and seat belts. The CDC's "Parents Are the Key" program has free templates.
Feedback works best when teens know about it
This is the research most articles skip. An IIHS study of in-vehicle monitoring found teen seat belt use improved when violations were reported to parents, and improved even more with in-car alerts. Consistent drops in speeding happened when teens received alerts and parents were notified too. A separate randomized study found that feedback to teens plus feedback to parents reduced risky driving, while feedback to teens alone did not.
The lesson is simple: open, agreed-upon check-ins beat secret tracking. When a teen knows you can see trips and speed, and you talk about it together, habits actually change.
A simple framework: match each rule to a real risk
Here is a framework we call the Five Risk Windows. Each row pairs a stat from this article with a house rule and a way to check in without hovering.
| Risk window | What the data says | House rule | Easy way to check in |
|---|---|---|---|
| Night | 53% of teen driving deaths: 6 p.m. to 3 a.m. | Home by an agreed curfew for the first 6 to 12 months | Curfew alert on your phone |
| Passengers | Risk up 44% with 1 teen passenger, doubles with 2 | No teen passengers at first, then one at a time | A quick text before any carpool |
| Phone | 46% of teen drivers text or email while driving | Phone in Do Not Disturb or the glovebox | Turn on driving focus mode together |
| Speed | Speed is a factor in almost 1 in 3 fatal teen crashes | Posted limit, no exceptions | Speeding alerts and weekly trip review |
| Seat belt | Nearly half of teen drivers killed were unbelted | Car doesn't move until everyone clicks | Make it a non-negotiable, like curfew |
Example: how one family could use this in the first 90 days
Illustrative scenario. A parent in suburban Ohio adds her 16-year-old to the family car. Month one: no passengers, home by 9 p.m., and a Sunday "trip review" where they look at the week's drives together on the app. Month two: one friend allowed on weekdays, curfew stays. Month three: the curfew moves to 10 p.m. on weekends because trip history shows steady speeds and on-time arrivals. The teen earns freedom with data instead of arguments, and the parent stops watching the clock every Friday night.
Where a GPS Tracker Fits In
A GPS tracker won't teach your teen to drive. What it does is give you quiet certainty about where your car is and how it is being driven, so the rules above are easy to keep without a string of "where are you?" texts. Parents of new drivers are one of the biggest groups of people we hear from at ShadowGPS, and the most common thing they tell us is that they want to worry less, not watch more.
ShadowAuto is built for exactly this. It updates your car's location every 5 seconds while it is moving, so the map on your phone matches the road. You plug it into the OBD-II port under the dashboard in under two minutes, no tools needed. From there you get speeding alerts, curfew and geofence alerts, crash alerts, trip history with replay, and the option to share live location with the rest of the family.

ShadowAuto
Plug-in · OBD-II · For cars & trucks
Plans $10-$13/mo (4+ trackers) or $12-$15/mo · No contract, ever.
- Speeding, curfew and geofence alerts
- Crash alerts and trip history with replay
- Powered by your car, nothing to charge


If your family has a second car that gets borrowed, or a car where the OBD-II port is hard to reach, ShadowTrack does the same job without plugging in. It runs on a rechargeable battery for up to about 15 days per charge and sits in a weatherproof magnetic case.
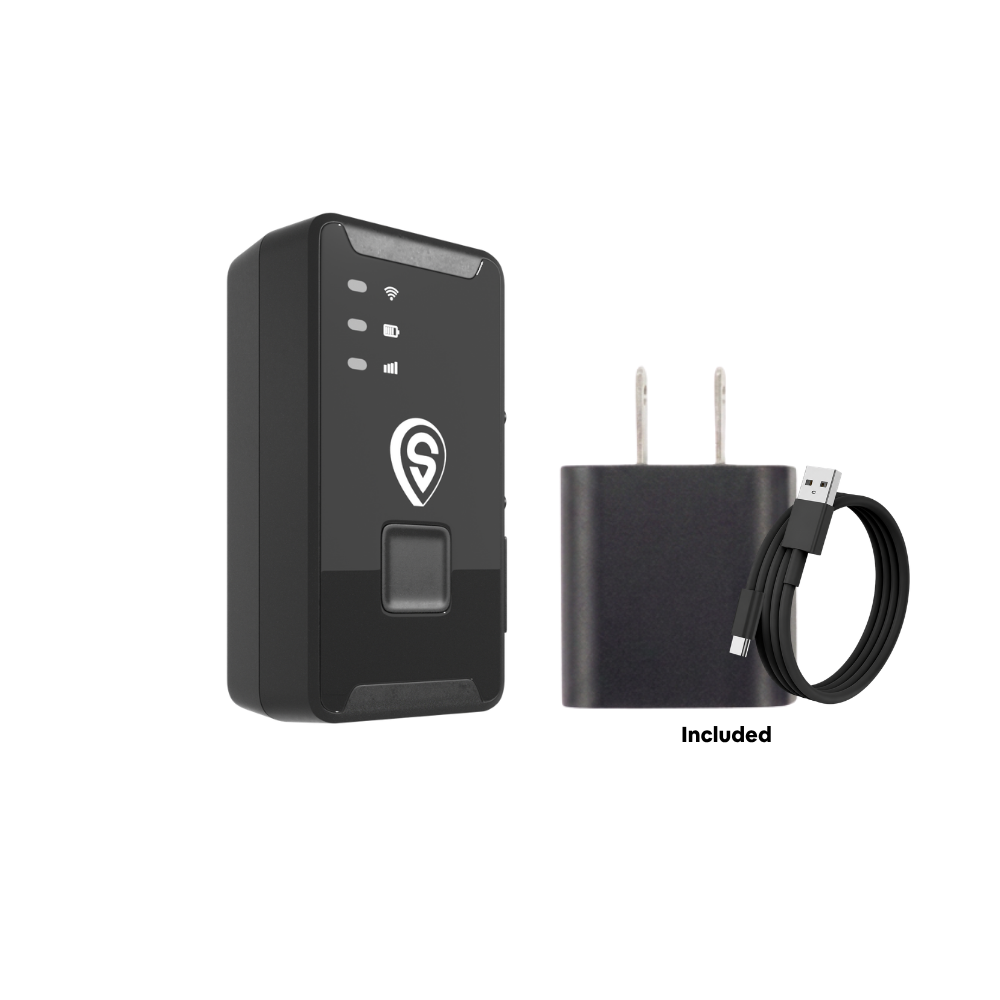
ShadowTrack
Battery · Magnetic · For any car or asset
Plans $10-$13/mo (4+ trackers) or $12-$15/mo · No contract, ever.
- Up to about 15 days per charge
- Weatherproof magnetic case
- Moves between cars in seconds
Best for: ShadowAuto for the car your teen drives every day; ShadowTrack for a shared or second family car.
One more thing, based on the research above: tell your teen the tracker is there and why. Frame it as part of the deal that gets them more freedom, not as a punishment. For more on setting this up, see our guide to GPS trackers for teen drivers: what every parent should know and how collision SOS alerts work.
Ways to Supervise a New Teen Driver, Compared
There is no single right tool. Many families combine a driving agreement with one tech option. Here is how the common choices stack up.
| Option | Tracks the car or the phone? | Speed and curfew alerts | Works if the phone dies or stays home | Ongoing cost |
|---|---|---|---|---|
| Parent-teen driving agreement | Neither (rules only) | No | n/a | Free |
| Phone location-sharing apps | The phone | Some apps, varies | No | Free to paid tiers |
| Insurer safe-driving programs | Phone app or plug-in, varies | Usually scores, not live alerts | Varies by program | Often free, may affect your rate |
| Dash camera | Records video only | No (most models) | Yes, but no live location | One-time purchase, some cloud plans |
| ShadowAuto GPS tracker | The car | Yes, plus geofence and crash alerts | Yes | $12-$15/mo, no contract |
Phone apps and insurer programs vary widely by provider; check each one's current features and terms.
Want a deeper look at phone-based options? Our comparison of family tracker apps for iPhone and Android covers them.
Key Takeaways
- The risk is real but concentrated. 2,899 teens died in crashes in 2024, with most deaths falling in nights, weekends and summer months.
- Distraction is bigger than official numbers suggest. Police data shows 7%, video shows 58%, and 46% of high school drivers admit to texting or emailing behind the wheel.
- Passengers and speed are as dangerous as phones. One teen passenger raises a 17-year-old's death risk per mile by 44%; speed is a factor in almost a third of fatal teen crashes.
- Rules plus open feedback work. Strong GDL rules cut crashes, and research shows feedback shared with both teens and parents changes behavior.
Teen Driving Statistics FAQ
How many teens die in car accidents each year?
In 2024, the latest full year of data, 2,899 U.S. teens ages 13 to 19 died in motor vehicle crashes, about eight per day. Of those, 2,565 were occupants of a car or other motor vehicle, and the rest were pedestrians, cyclists and others.
What is the leading cause of death for teenagers in the U.S.?
Motor vehicle crashes were the leading cause of death for both male and female teens ages 13 to 19 in 2024, according to CDC data compiled by IIHS, ahead of homicide and suicide.
Why are teen drivers more likely to crash?
Two reasons: inexperience and immaturity. New drivers are still learning to spot and react to hazards, and teens are more likely to speed, get distracted, drive at night, carry teen passengers and skip seat belts. Risk is highest at ages 16 and 17 and in the first months after licensing.
What age group has the most car accidents?
Per mile driven, drivers ages 16 to 19 have the highest crash rate of any age group. IIHS puts their rate of police-reported crashes at more than four times that of drivers 20 and older, and their fatal crash rate at about three times higher.
What percentage of teen crashes involve distracted driving?
It depends on how you measure. Police reports flagged 7% of teen drivers in 2024 fatal crashes as distracted. A AAA Foundation study of in-car crash video found distraction in 58% of moderate-to-severe teen crashes, which is likely closer to reality.
How many teens text while driving?
The CDC's 2025 Youth Risk Behavior Survey found 46% of high school students who drove in the past 30 days texted or emailed while driving, similar to 42% in 2023.
What time of day do most teen car crashes happen?
Evenings and nights. In 2024, teen crash deaths were most common from 9 p.m. to midnight (18%), 6 p.m. to 9 p.m. (18%) and midnight to 3 a.m. (17%). Over half happened on Friday, Saturday or Sunday.
What are the 100 Deadliest Days for teen drivers?
It is AAA's name for the period between Memorial Day and Labor Day, when fatal crashes involving teen drivers rise. AAA reports more than 30% of fatal teen-driver crashes happen in those 100 days.
Do GPS trackers help teens drive more safely?
They can, when teens know about them. IIHS research on in-vehicle monitoring found seat belt use and speeding improved when teens got alerts and parents were notified. A tracker works best alongside clear house rules and regular, calm trip reviews.
Is there a monthly fee for a teen driver GPS tracker?
Most real-time GPS trackers use a cellular connection, so yes. ShadowGPS plans run $12 to $15 a month (or $10 to $13 for 4+ trackers), with no contract. Go month-to-month, or prepay and save, and cancel any time. See the full pricing page.
Does a teen driver GPS tracker need a SIM card?
You don't need to buy or add one. ShadowAuto and ShadowTrack come ready to connect, and the cellular service is included in your plan. Our explainer on whether a GPS tracker needs a SIM card covers the details.
Is it legal to put a GPS tracker on my teen's car?
In general, you can track a car you own or co-own, including one your minor child drives. Laws vary by state, especially for cars titled in someone else's name or drivers over 18, so check your state's rules. This isn't legal advice.
Hand over the keys with a little more certainty
Plug it in, see it move, and cancel any time. Your teen gets their freedom, and you get a clear view of where your car is.
Sources
- IIHS: Fatality Facts 2024, Teenagers
- IIHS: Teenagers research area (GDL, parents, monitoring studies)
- NHTSA: Teens and Distracted Driving in 2024
- NHTSA: Distracted Driving
- National Safety Council: Injury Facts, Teen Drivers
- CDC: Youth Risk Behavior Survey, Digital Behaviors (2025)
- CDC: Risk Factors for Teen Drivers
- AAA Foundation: Teen Driver Risk and Number of Passengers
- Zutobi: Teen Driver Report (state rankings)
- NHTSA Traffic Safety Marketing: Teen Driver Safety Week
Statistics current as of September 2026 and based on the most recent complete data available (mostly 2024 crash year). Pricing current as of September 2026. ShadowGPS may earn a commission from Amazon and Best Buy links. Tracking laws vary by state; this article is for general information and is not legal advice.

