

Here's the good news first: vehicle theft in America just had its best two years in modern record-keeping. After topping one million stolen vehicles in 2023, thefts fell to 659,880 in 2025, and early 2026 data shows the drop is still going.
But "lower" isn't "gone." A vehicle is still stolen somewhere in the U.S. every 48 seconds, about one in five never comes home, and police solve fewer than one in ten cases. This guide pulls the latest vehicle theft statistics from NICB, the FBI, the Council on Criminal Justice and HLDI into one place, then turns them into plain answers for the person who owns a car or truck that matters.
659,880 vehicles were reported stolen in the U.S. in 2025, down 23% from 2024 and 35.4% from the 2023 peak of 1,020,729. That still works out to one theft every 48 seconds. California had the most thefts (136,988), the Hyundai Elantra was the most stolen model (21,732), and in large U.S. cities, thefts fell another 20% in the first half of 2026.
Vehicle Theft Statistics at a Glance (2026)
If you only have a minute, these are the numbers that matter most right now. Each one is sourced to the organization that published it, and we explain the context further down.
| Vehicle theft stat | Latest figure | Source |
|---|---|---|
| Vehicles stolen in 2025 | 659,880 | NICB |
| Change from 2024 | Down 23% (190,828 fewer thefts) | NICB |
| Change from 2023 peak | Down 35.4% | Insurance Information Institute |
| How often a vehicle is stolen | Every 48 seconds | NICB |
| Early 2026 trend (large cities) | Down 20% vs. first half of 2025 | Council on Criminal Justice |
| Share not recovered (2025) | About 21% | NICB |
| State with the most thefts | California, 136,988 | NICB |
| Most stolen model | Hyundai Elantra, 21,732 | NICB |
| Most stolen pickup | Chevrolet Silverado 1500, 16,764 | NICB |
| Theft cases cleared by police (2023) | 8.2%, lowest of any major crime | FBI data |
How Many Vehicles Are Stolen in the U.S. Each Year?

According to the National Insurance Crime Bureau's 2025 report, 659,880 vehicles were reported stolen last year. NICB calls it a historic low and a clear sign the pandemic-era surge is over.
That decline came on top of a 17% drop in 2024, which at the time was the largest one-year decrease in 40 years. Two record years back to back is what makes the current trend so unusual.
| Year | Vehicles reported stolen | What happened |
|---|---|---|
| 2021 | 932,329 | Up 6% over 2020 as the pandemic surge built |
| 2023 | 1,020,729 | Peak year, highest volume in over 40 years |
| 2024 | 850,708 | Down 17%, largest drop in 40 years at the time |
| 2025 | 659,880 | Down 23%, lowest total in decades |
| First half of 2026 | National total not yet released | Down 20% in a 36-city sample (CCJ) |
A theft every 48 seconds
Even at record-low levels, the national pace still works out to one stolen vehicle every 48 seconds, or roughly 1,800 a day. At the 2023 peak it was closer to one every 31 seconds.
That's the number worth holding onto. Theft is down a lot, but it's still one of the most common property crimes in the country.
Theft rate per 100,000 people
Raw counts are useful, but rates let you compare places fairly. NICB put the 2024 national rate at 250.2 thefts per 100,000 residents. With 2025's lower total, the national rate is now roughly 193 per 100,000.
The FBI's own data points the same way. Its 2024 national crime summary shows the motor vehicle theft rate fell 19.4% from 2023, though it stayed higher than every year from 2010 through 2021.
Why NICB and FBI numbers don't match exactly
NICB counts thefts reported to the National Crime Information Center, while the FBI builds estimates from agencies reporting to its crime programs. The totals differ a little, but both show the same record decline, which is a good sign the trend is real.
Is Vehicle Theft Still Going Down in 2026?
Yes, based on the earliest data available. The Council on Criminal Justice's mid-year 2026 report found 20% fewer motor vehicle thefts in the first half of 2026 than in the same period of 2025, across 36 large U.S. cities.
CCJ also found motor vehicle theft in those cities is now 51% below its 2023 peak and about 3% below the first half of 2019. In plain terms, big-city car theft has finally dipped under pre-pandemic levels.
Not every city is following the national trend
City-level numbers are a good reminder that national averages can hide local spikes. In Chicago, CCJ found motor vehicle theft rose 8% in the first half of 2026 and remains 96% above 2019 levels.
Washington, D.C. went the other way, with thefts down 54% year over year. If you want to know your real risk, your city and your parking spot matter more than the national headline.
Why Did Vehicle Theft Drop So Fast?
No single fix did this. NICB credits coordinated work between law enforcement, automakers, insurers and state theft-prevention programs. Here are the three biggest drivers, with the evidence behind each.
Case study: the Hyundai and Kia fix
The clearest example of prevention working is the Hyundai and Kia theft wave. Many older models shipped without engine immobilizers, a weakness that spread on social media and pushed these brands to 21% of all U.S. thefts in 2023.
After software upgrades and steering wheel lock giveaways, their share fell to 16% in 2024 and 14% in 2025. The Highway Loss Data Institute found upgraded vehicles had 64% fewer whole-vehicle theft claims than non-upgraded ones.
The takeaway for any owner: anti-theft technology measurably works. Still, Hyundai and Kia models held four of 2025's top seven most-stolen spots, so older, un-updated cars remain targets.
State auto theft prevention programs
NICB points out that four of the five states with the biggest 2025 drops in theft volume have funded Auto Theft Prevention Authorities: California, Texas, Washington and Colorado. These programs pay for task forces, plate readers and public awareness work.
Supply chains and enforcement caught up
During the pandemic, parts shortages made stolen vehicles and parts more valuable. As supply returned to normal and prosecutors went after organized theft rings, some of that incentive faded.
Where Are Vehicles Stolen Most?
Vehicle theft is heavily concentrated. NICB found more than one-third of all 2025 thefts happened in just 10 metro areas, and one state accounted for over a fifth of the national total.
Top 10 states by total vehicle thefts (2025)
| Rank | State | 2025 thefts |
|---|---|---|
| 1 | California | 136,988 |
| 2 | Texas | 75,269 |
| 3 | Illinois | 28,327 |
| 4 | Florida | 27,142 |
| 5 | New York | 24,206 |
| 6 | Ohio | 20,628 |
| 7 | Pennsylvania | 20,568 |
| 8 | North Carolina | 20,395 |
| 9 | Washington | 18,039 |
| 10 | Missouri | 17,496 |
Highest theft rates by state
By rate instead of raw count, the picture changes. In NICB's first-half 2025 data, Washington, D.C. led the country at about 373 thefts per 100,000 residents, nearly four times the national six-month average of 97.33.
The rest of the top five by rate were California, Nevada, New Mexico and Colorado. Smaller states like Nevada and New Mexico rarely show up on raw-count lists, yet drivers there face above-average risk.
Top 10 metro areas by total vehicle thefts (2025)
| Rank | Metro area | 2025 thefts |
|---|---|---|
| 1 | Los Angeles-Long Beach-Anaheim, CA | 53,911 |
| 2 | New York-Newark-Jersey City, NY-NJ | 27,138 |
| 3 | Chicago-Naperville-Elgin, IL-IN | 24,299 |
| 4 | Houston-Pasadena-The Woodlands, TX | 23,659 |
| 5 | San Francisco-Oakland-Fremont, CA | 22,197 |
| 6 | Dallas-Fort Worth-Arlington, TX | 21,638 |
| 7 | Philadelphia-Camden-Wilmington, PA-NJ-DE-MD | 19,117 |
| 8 | Washington-Arlington-Alexandria, DC-VA-MD-WV | 15,204 |
| 9 | Riverside-San Bernardino-Ontario, CA | 14,111 |
| 10 | Seattle-Tacoma-Bellevue, WA | 12,684 |
By rate, San Francisco-Oakland-Fremont (477.51 per 100,000) and Bakersfield-Delano (477.27) had the highest metro theft rates in 2025, pushing Memphis to third at 427.75.
States with the biggest drops
Washington State had the largest 2025 decline at 39%, followed by Colorado (35%), Puerto Rico (34%), South Dakota (32%), and Tennessee and New Mexico (both 31%). Florida, Georgia and Arizona also fell by more than a quarter.
The Most Stolen Vehicles in America
There are two ways to measure "most stolen." NICB counts total thefts, which favors popular models with lots of cars on the road. HLDI measures theft claims per insured vehicle, which shows true risk per car.
Most stolen vehicles by total thefts (2025)
| Rank | Make and model | 2025 thefts |
|---|---|---|
| 1 | Hyundai Elantra | 21,732 |
| 2 | Honda Accord | 17,797 |
| 3 | Hyundai Sonata | 17,687 |
| 4 | Chevrolet Silverado 1500 | 16,764 |
| 5 | Honda Civic | 12,725 |
| 6 | Kia Optima | 11,521 |
| 7 | Ford F-150 | 10,102 |
| 8 | Toyota Camry | 9,833 |
| 9 | Honda CR-V | 9,809 |
| 10 | Nissan Altima | 8,445 |
For a model-by-model look at recovery, see our breakdown of the 10 most stolen vehicles in 2025.
Pickups: the costliest vehicles to lose
Two full-size pickups made the top seven, and HLDI's data explains why owners of work trucks should pay attention. In its 2022 to 2024 model-year report, pickups had the highest whole-vehicle theft claim frequency of any vehicle type.
What a stolen pickup costs insurers
Pickups also had the highest average payout per whole-vehicle theft, at $66,984. That figure doesn't include the tools, equipment or lost work days that go with a stolen work truck.
Highest theft risk per vehicle
By claim frequency, HLDI found the Chevrolet Camaro ZL1 was stolen at roughly 39 times the average rate, thanks to a security weakness GM later addressed with a software update. Large pickups and SUVs filled most of the rest of the high-risk list.
At the other end, the Tesla Model 3 AWD had the lowest whole-vehicle theft claim frequency. HLDI notes EVs may be garaged more often, and many use app-based keys and built-in location tracking.
What Are the Odds of Getting a Stolen Car Back?
Most stolen vehicles are recovered, but "recovered" doesn't always mean "in one piece," and timing matters more than most people realize.
- About 21% unrecovered. NICB reports roughly one in five vehicles stolen in 2025 had not been recovered.
- The first 48 hours decide most cases. NICB data shows 34% of recovered vehicles are found the same day and 45% within two days.
- Recreational vehicles fare worse. NICB estimates 63% of motorcycles, ATVs, snowmobiles and watercraft stolen in 2025 remain unrecovered.
- Recovery rates vary by source. FBI incident data shows lower overall recovery than NICB because it counts vehicles and time windows differently.
Why police rarely solve vehicle thefts
Only 8.2% of motor vehicle thefts were cleared nationally in 2023, the lowest clearance rate ever recorded for any crime type in FBI data, according to crime analyst Jeff Asher. Some cities were far lower.
That doesn't mean police don't care. It means that when a vehicle's location is unknown, there's often little to go on. When you can hand officers a live location, the odds shift in your favor. Here's more on how GPS tracking helps law enforcement.
When and How Vehicles Get Stolen
Knowing the "when" and "how" helps you focus on the habits that actually lower your risk.
Time of day and location
FBI incident data analyzed by FinanceBuzz shows most thefts happen at night, with activity peaking between midnight and 1 a.m. Roads, streets and sidewalks account for over half of reported thefts, which is why overnight street parking carries the most risk.
Keys and fobs left inside
More than 100,000 vehicles, about 11% of all thefts, were stolen with the keys or fob left inside in 2021, the most recent year NICB published this breakdown. NICB notes the real number is likely higher, since many owners never admit it.
Warming up a car on a cold morning or leaving a truck running at a job site takes seconds for a thief to exploit. This is the most preventable slice of all vehicle theft.
Carjacking is falling too
CCJ found carjackings in large cities were 51% below 2019 levels in the first half of 2026 and 73% below their 2023 peak. Violent vehicle theft is still frightening, but it's much less common than it was.
Automobiles vs. trucks
In FBI data from 2019 to 2023, automobiles made up 78.1% of stolen motor vehicles, trucks 12.2% and other motor vehicles 8.0%.
How Much Does Vehicle Theft Cost?
The official cost figures are dated, so treat them as a floor, not a ceiling. Vehicle prices have climbed a lot since most of them were published.
- More than $8 billion a year: NHTSA's estimate of what vehicle theft costs American owners (2022 figure).
- $8,886 per vehicle: the FBI's most recent per-vehicle average, from 2019, across $6.4 billion in total losses.
- $22,883 per claim: HLDI's average whole-vehicle theft payout for a 2022 to 2024 Hyundai Elantra.
- $66,984 per claim: HLDI's average whole-vehicle theft payout for pickups, the highest of any vehicle type.
None of those numbers include your deductible, rental costs, missed work, or a higher premium at renewal. For a small business, lost jobs and replacement tools often sting more than the truck itself.
What These Vehicle Theft Stats Mean for You
National numbers are only useful if they change what you do. Here's how the data maps to the three situations we hear about most.
The family car and a teen driver
The top models on the stolen list, like the Elantra, Accord, Civic and Camry, are exactly the dependable used cars parents buy for new drivers. An older car isn't a safer one if it lacks modern anti-theft tech.
The Turo or rental host
Your car spends time with strangers and often parks on unfamiliar streets overnight, the highest-risk time and place in the data. Knowing where it is between trips protects both the car and your listing. See our Turo host page.
The 2 to 5 truck owner-operator
Pickups carry the highest theft payouts, and a truck left idling at a job site is the classic keys-inside theft. One stolen truck can mean lost jobs, lost tools and a week of scrambling.
The Layered Protection Framework
NICB recommends a layered approach, because no single device stops every thief. Each layer filters out a different kind of theft, from the opportunist checking door handles to a crew that came prepared.
- Common sense. Lock your doors, close your windows, take your keys, and never leave your car running unattended.
- Visible deterrents. Steering wheel locks, alarms and window etching tell a thief to move on.
- Immobilizers and kill switches. These stop your car from starting without the right key or switch. Make sure any available software updates are done.
- Tracking. NICB lists aftermarket GPS tracking as the layer that helps you find your car if the first three fail.
Anti-theft options compared
| Option | Stops the theft? | Helps you get it back? | Alerts your phone? | Best for |
|---|---|---|---|---|
| Steering wheel lock | Deters it | No | No | Older cars without immobilizers |
| Factory or aftermarket alarm | Deters it | No | Some models | Driveways and parking lots |
| Immobilizer or kill switch | Often, yes | No | No | Blocking keyless or hot-wire starts |
| Bluetooth tag (AirTag, Tile) | No | Sometimes, near other phones | Limited | Keys and bags, not a car first |
| Battery GPS tracker | No | Yes, over cellular | Yes | Trailers, equipment, hidden placement |
| ShadowAuto (plug-in GPS tracker) | No, but alerts you fast | Yes, live location while it moves | Yes, Car Alarm and geofence alerts | Cars, trucks, Turo cars, small fleets |
No tracker physically stops a theft. The goal of the tracking layer is to shrink the time between "my car is gone" and "I know exactly where it is." Bluetooth tags depend on nearby phones and are not true GPS trackers; see why AirTags fall short for cars.
Where a GPS Tracker Fits In
The data points to one clear gap. Recovery depends on the first 48 hours, and police clear fewer than one in ten cases, so what helps most is knowing where your car is, right away, without waiting on anyone else.
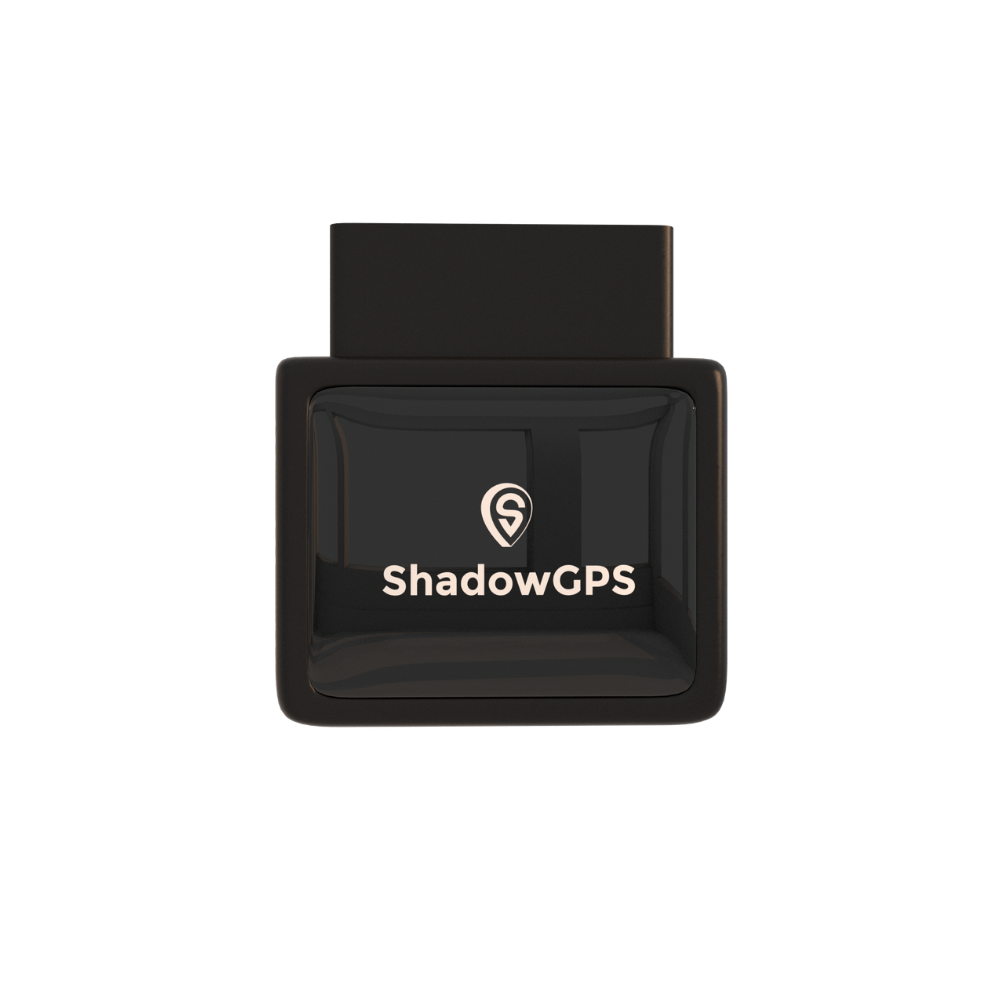
That's the job ShadowAuto was built for. It updates your car's location every 5 seconds while it's moving, so you're watching a live dot on the map, not a stale pin from minutes ago.
It's also simple. You plug it into your car's OBD-II port in under 2 minutes, with no tools and no one to hire. Not sure where the port is? Find your OBD-II port in 30 seconds.
And it gives you certainty. Car Alarm and geofence alerts tell your phone when your car moves when it shouldn't, and trip timeline and trip replay show exactly where it's been. Plans run $12 to $15 a month with no contract, ever: go month-to-month, or prepay and save.
ShadowAuto
- Plugs into your OBD-II port in under 2 minutes
- Car Alarm, geofence and tamper alerts on your phone
- Live tracking, trip timeline and trip replay


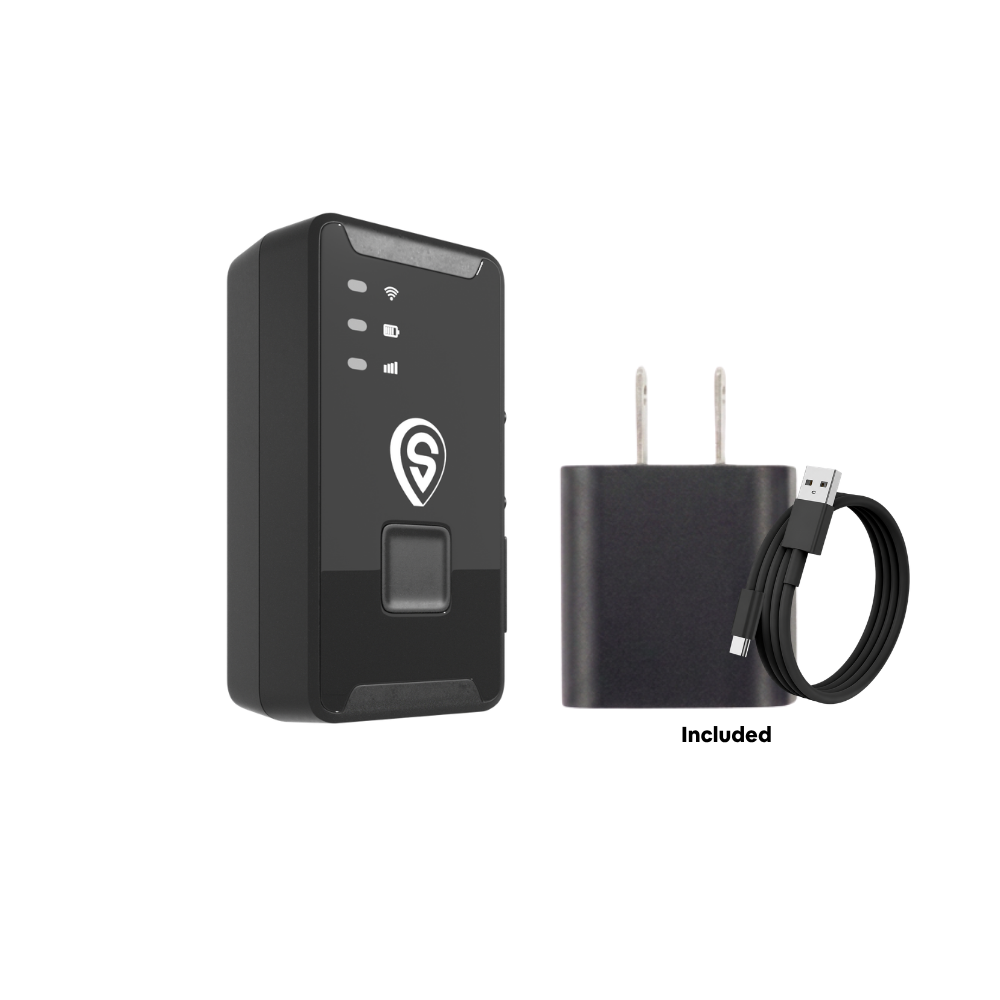
If what you're protecting doesn't have an OBD-II port, like a trailer, an ATV, a boat or a piece of equipment, ShadowTrack is the better fit. That matters, since NICB says most stolen recreational vehicles are never recovered. It runs on a rechargeable battery for up to about 15 days per charge and hides anywhere with its magnetic, weatherproof case.
ShadowTrack
- Up to about 15 days per charge
- Magnet-mount or hide it in under 2 minutes
- Weatherproof magnetic case
Not sure which form factor suits you? Our OBD-II vs. battery tracker guide walks through it, and our best GPS trackers for cars roundup compares the wider field.
What to Do If Your Car Is Stolen
Because the first 48 hours matter so much, it helps to know the steps before you ever need them.
- Confirm it wasn't towed. Call the local police non-emergency line or check your city's tow lookup.
- Check your tracker. If you have one, open the app and note the live location and the trip history. Don't try to recover the car yourself.
- Report it to police right away. Give them your VIN, plate number, a description and any live location you have.
- Call your insurer. Comprehensive coverage is what typically covers theft, so file the claim quickly.
- Notify your lender or leasing company, and for Turo or rental cars, the platform.
For a full checklist, read our immediate recovery steps for a stolen vehicle.
How we sourced these vehicle theft statistics
Every figure in this guide comes from its original publisher: NICB's 2025 Vehicle Theft Report and first-half 2025 update, FBI Uniform Crime Reporting data, the Council on Criminal Justice's mid-year 2026 city report, HLDI's whole-vehicle theft insurance reports, the Insurance Information Institute, and NHTSA. Where sources measure things differently, such as recovery rates, we say so rather than picking the friendlier number. Older figures, like the FBI's 2019 cost average and NICB's 2021 keys-inside count, are labeled with their year. We update this page as new national data is released.
Frequently Asked Questions
How many cars are stolen in the U.S. each year?
NICB reports 659,880 vehicles were stolen in 2025, down from 850,708 in 2024 and a peak of 1,020,729 in 2023. That's still about 1,800 vehicles a day, or one every 48 seconds.
Is car theft going up or down in 2026?
Down so far. The Council on Criminal Justice found 20% fewer motor vehicle thefts in the first half of 2026 than in the first half of 2025 across 36 large U.S. cities, though a few cities, like Chicago, saw increases.
What is the most stolen car in America?
By total thefts, the Hyundai Elantra, with 21,732 stolen in 2025. The Honda Accord (17,797) and Hyundai Sonata (17,687) followed, and the Chevrolet Silverado 1500 was the most stolen pickup at 16,764.
Which state has the most vehicle thefts?
California, with 136,988 thefts in 2025, more than 20% of the national total. Texas was second with 75,269. By rate per resident, Washington, D.C. ranks highest.
What percentage of stolen cars are recovered?
NICB reports about 21% of vehicles stolen in 2025 were not recovered, so roughly four in five come back. Of those recovered, 34% are found the same day and 45% within two days. FBI data shows lower recovery because it counts differently.
What time of day are most cars stolen?
Most thefts happen at night, with FBI incident data showing a peak between midnight and 1 a.m. Cars parked on streets overnight face the highest risk.
How often are car thefts solved by police?
Rarely. Only about 8.2% of motor vehicle thefts were cleared nationally in 2023, the lowest clearance rate of any crime type in FBI records. That's why a live location from a tracker can make such a difference.
Does a GPS tracker help recover a stolen car?
A tracker can't stop a theft, but it can show you and police where your car is while it's still in the critical first hours. NICB lists GPS tracking as its final layer of protection for exactly that reason.
Is there a monthly fee for a GPS tracker?
Most real-time GPS trackers need a plan because they use a cellular connection. ShadowGPS plans run $12 to $15 a month with no contract, ever. Go month-to-month, or prepay and save.
Does a GPS tracker need a SIM card?
Not one you have to buy. ShadowAuto and ShadowTrack have cellular connectivity built in, so you just plug it in or place it and open the app. Here's the full answer on whether a GPS tracker needs a SIM card.
Know where your car is, every time
Vehicle theft is falling, but it hasn't stopped. Plug it in, see it move, and cancel any time.
Statistics last reviewed September 2026. Sources: NICB 2025 Vehicle Theft Report, NICB Prevent Vehicle Theft, NICB first-half 2025 report, Council on Criminal Justice, Insurance Information Institute, HLDI, FBI Uniform Crime Reporting and NHTSA. Recreational vehicle recovery figure via Carrier Management. Prices current as of September 2026. This post contains affiliate links; we may earn a commission on qualifying purchases at no extra cost to you. Never place a tracker on a vehicle you don't own or have permission to track.
