

Here's the surprise in the newest data: car theft is falling in every single state. In the first half of 2026, 268,415 vehicles were reported stolen nationwide, 21% fewer than a year earlier, and all 50 states posted a decline.
So why does "where is car theft rising" still matter? Because a falling national number hides real differences. Some states barely improved. One state actually went up in 2025. And one of the biggest metro areas in the country is moving the wrong way right now.
Below you'll find car theft statistics by US state for all 50 states, ranked by theft rate, plus the places where theft is rising or falling slowest, the metros to watch, the most stolen models, and a simple plan to protect your car or truck wherever you park it.
California has the highest car theft rate in the US at 348 thefts per 100,000 residents (136,988 thefts in 2025). New Hampshire has the lowest at 40.3. Alaska was the only state where theft rose in 2025 (up 7%), and in the first half of 2026 every state declined, with the Chicago metro (up 2%) the only top-10 metro area where thefts increased.
Car theft statistics by US state: the 2026 snapshot
If you only have 30 seconds, these are the numbers that matter. Everything comes from the National Insurance Crime Bureau (NICB), which compiles stolen-vehicle reports from law enforcement through the FBI's National Crime Information Center.
- 659,880 vehicles were stolen in 2025, down 23% from 850,708 in 2024 and down 35% from the 2023 peak of 1,020,729.
- That's one vehicle every 48 seconds in 2025, and roughly one every minute in the first half of 2026.
- The national theft rate was about 193 per 100,000 residents in 2025, and 77.81 per 100,000 for the first six months of 2026.
- California alone accounts for more than 20% of all US thefts, and recorded 57,821 more in the first half of 2026.
- 12 states still sit above 200 thefts per 100,000, even after the drop. Most are in the West.
- Hyundai and Kia's share of thefts fell to 14% in 2025, down from 21% in 2023, as anti-theft software updates rolled out.
Good news, clearly. But a national average is the wrong lens for one owner. Your car doesn't live in "the US." It lives in a state, a metro, a driveway, and a parking lot at work. That's where the rest of this guide goes.
All 50 states ranked by car theft rate (2025)
This is the full-year 2025 ranking, the most recent complete year available. The rate column shows thefts per 100,000 residents, which is the fairest way to compare a giant state like Texas with a small one like Vermont. We added a risk tier so you can see your state's standing at a glance.
| Rank | State | Thefts per 100K | Total thefts | Change vs. 2024 | Risk tier |
|---|---|---|---|---|---|
| 1 | California | 348.0 | 136,988 | -25% | High |
| 2 | Nevada | 318.3 | 10,357 | -19% | High |
| 3 | New Mexico | 318.3 | 6,769 | -31% | High |
| 4 | Missouri | 280.2 | 17,496 | -27% | High |
| 5 | Colorado | 280.1 | 16,774 | -35% | High |
| 6 | Maryland | 272.9 | 17,044 | -21% | High |
| 7 | Texas | 240.3 | 75,269 | -23% | High |
| 8 | Alaska | 232.2 | 1,710 | +7% | High |
| 9 | Washington | 227.5 | 18,039 | -39% | High |
| 10 | Illinois | 223.0 | 28,327 | -18% | High |
| 11 | Oregon | 207.9 | 8,868 | -26% | High |
| 12 | Kansas | 201.4 | 5,973 | -23% | High |
| 13 | Tennessee | 188.1 | 13,642 | -31% | Elevated |
| 14 | Louisiana | 187.6 | 8,659 | -26% | Elevated |
| 15 | North Carolina | 184.5 | 20,395 | -19% | Elevated |
| 16 | South Carolina | 183.6 | 10,082 | -21% | Elevated |
| 17 | Ohio | 173.9 | 20,628 | -17% | Elevated |
| 18 | Oklahoma | 172.3 | 7,062 | -15% | Elevated |
| 19 | Michigan | 171.3 | 17,298 | -22% | Elevated |
| 20 | Arizona | 168.9 | 12,760 | -27% | Elevated |
| 21 | Nebraska | 168.1 | 3,372 | -18% | Elevated |
| 22 | Minnesota | 165.1 | 9,570 | -22% | Elevated |
| 23 | Connecticut | 161.0 | 5,916 | -25% | Elevated |
| 24 | Indiana | 160.2 | 11,106 | -22% | Elevated |
| 25 | Pennsylvania | 157.7 | 20,568 | -4% | Elevated |
| 26 | Delaware | 156.3 | 1,641 | -12% | Elevated |
| 27 | Georgia | 153.8 | 17,237 | -28% | Elevated |
| 28 | Mississippi | 153.4 | 4,526 | -21% | Elevated |
| 29 | Kentucky | 151.1 | 6,926 | -20% | Elevated |
| 30 | South Dakota | 149.2 | 1,383 | -32% | Moderate |
| 31 | New Jersey | 148.6 | 14,124 | -7% | Moderate |
| 32 | Alabama | 145.2 | 7,494 | -20% | Moderate |
| 33 | Arkansas | 144.3 | 4,469 | -24% | Moderate |
| 34 | Montana | 125.2 | 1,424 | -24% | Moderate |
| 35 | New York | 121.0 | 24,206 | -15% | Moderate |
| 36 | Wisconsin | 117.8 | 7,020 | -20% | Moderate |
| 37 | North Dakota | 117.5 | 932 | -30% | Moderate |
| 38 | Florida | 116.7 | 27,142 | -29% | Moderate |
| 39 | Vermont | 113.1 | 731 | -23% | Moderate |
| 40 | Hawaii | 110.4 | 1,584 | -11% | Moderate |
| 41 | Virginia | 108.1 | 9,537 | -24% | Moderate |
| 42 | Rhode Island | 107.3 | 1,191 | -13% | Moderate |
| 43 | Iowa | 101.9 | 3,293 | -17% | Moderate |
| 44 | Utah | 90.4 | 3,166 | -20% | Low |
| 45 | Massachusetts | 89.6 | 6,393 | -15% | Low |
| 46 | West Virginia | 82.0 | 1,450 | -22% | Low |
| 47 | Wyoming | 73.3 | 430 | -25% | Low |
| 48 | Maine | 60.6 | 853 | -23% | Low |
| 49 | Idaho | 53.9 | 1,078 | -22% | Low |
| 50 | New Hampshire | 40.3 | 567 | -16% | Low |
Source: NICB 2025 Year-End National Vehicle Thefts by State; rates use U.S. Census Bureau 2025 population estimates. Nevada and New Mexico tie at 318.3 when rounded. Risk tiers are ShadowGPS groupings: High (200+), Elevated (150 to 199), Moderate (100 to 149), Low (under 100). Washington, D.C. is not a state and is covered separately below.
How to read this table
Rate tells you your odds. Volume tells you where the most cars go missing. California leads both, which is unusual. Texas is second by volume but seventh by rate, because its population is so large.
To make the rate feel real: in California, roughly 1 in every 287 residents had a vehicle stolen in 2025. In New Hampshire, it was about 1 in 2,480. Same country, an almost 9x difference in risk.
Where car theft is rising fastest (and falling slowest)
Let's be straight with you, because a lot of headlines aren't. No state saw car theft increase in the first half of 2026. NICB confirmed that all 50 states declined. So "rising fastest" right now means three specific things, and each one matters for a different reader.
1. Alaska: the only state that went up in 2025
Alaska was the lone state where thefts increased for the full year, up 7% to 1,710 stolen vehicles. That pushed it to 8th place nationally at 232.2 thefts per 100,000 residents, ahead of states with far bigger cities.
The spike started early. NICB flagged a 26% jump in the first half of 2025, driven mostly by the Anchorage metro area. Alaska joined the national decline in early 2026, but it still entered the year with one of the highest theft rates in the country.
2. The slow decliners: where risk is rising relative to everyone else
When the national number drops 23% and your state drops 4%, your car is relatively more exposed than it was a year ago. These states improved the least in 2025:
| State | 2025 change | vs. national (-23%) | 2025 thefts | Rate per 100K |
|---|---|---|---|---|
| Alaska | +7% | 30 points worse | 1,710 | 232.2 |
| Pennsylvania | -4% | 19 points worse | 20,568 | 157.7 |
| New Jersey | -7% | 16 points worse | 14,124 | 148.6 |
| Hawaii | -11% | 12 points worse | 1,584 | 110.4 |
| Delaware | -12% | 11 points worse | 1,641 | 156.3 |
| Rhode Island | -13% | 10 points worse | 1,191 | 107.3 |
| Oklahoma, New York, Massachusetts | -15% | 8 points worse | 7,062 / 24,206 / 6,393 | 172.3 / 121.0 / 89.6 |
Source: NICB 2025 Year-End National Vehicle Thefts by State. "Points worse" is the gap between each state's change and the 23% national decline.
Pennsylvania is the one to watch. It's the 7th-largest state by theft volume, and its total barely moved while nearly every other big state fell by double digits. The Philadelphia metro still ranked 7th nationally in the first half of 2026.
Delaware shows how fast this can change. It lagged in 2025, then posted one of the biggest drops in early 2026 (down 32%). That's a reminder that one year is a data point, not a destiny.
3. Chicago: the one big metro moving the wrong way in 2026
Among the 10 metro areas with the most thefts, Chicago-Naperville-Elgin was the only one to increase in the first half of 2026, up 2% to 11,761 stolen vehicles. That made it the second-highest metro by volume, behind only Los Angeles.
Illinois as a whole is 3rd in the country by volume (28,327 thefts in 2025) and 10th by rate. If you park in Chicago or the collar counties, the statewide decline isn't the full story for you.
What "rising" means when the national number is falling
Think of it like a tide going out. Almost every boat drops, but some drop slower, and a few get caught on the rocks. A state with a high rate and a slow decline (Pennsylvania, Illinois, Alaska) carries more risk than a state with a moderate rate that's falling fast. We use both numbers together in the framework further down.
States where car theft is falling fastest in 2026
On the other side of the ledger, these states posted the steepest declines from January through June 2026 compared with the same months of 2025.
| State | H1 2026 thefts | H1 2025 thefts | Change |
|---|---|---|---|
| Washington, D.C. | 1,262 | 2,641 | -52% |
| Tennessee | 4,528 | 7,754 | -42% |
| Vermont | 244 | 385 | -37% |
| New Hampshire | 193 | 295 | -35% |
| Colorado | 5,902 | 9,052 | -35% |
| Delaware | 581 | 858 | -32% |
| Florida | 10,211 | 14,873 | -31% |
| New Mexico | 2,516 | 3,644 | -31% |
| Nevada | 3,897 | 5,607 | -30% |
| Kansas | 2,155 | 3,080 | -30% |
| Iowa | 1,182 | 1,693 | -30% |
| Missouri | 6,386 | 9,108 | -30% |
Source: NICB first-half 2026 release, September 30, 2026.
Colorado is the clearest policy example. The state made every car theft a felony regardless of what the car is worth, and it has gone from the top of the national rankings in 2022 to a 35% drop in early 2026. Washington State posted the largest full-year decline in 2025 (down 39%) after a similar enforcement push.
Notice how many high-rate states are on this list: Nevada, New Mexico, Missouri, Colorado. They're improving fast, but from a very high starting point. Falling fast and still high can both be true.
States with the most car thefts by volume
Volume is useful if you're thinking about where organized theft rings operate and where insurers see the most claims. These ten states accounted for well over half of all thefts in 2025.
| Rank | State | 2025 thefts | Share of US total |
|---|---|---|---|
| 1 | California | 136,988 | 20.8% |
| 2 | Texas | 75,269 | 11.4% |
| 3 | Illinois | 28,327 | 4.3% |
| 4 | Florida | 27,142 | 4.1% |
| 5 | New York | 24,206 | 3.7% |
| 6 | Ohio | 20,628 | 3.1% |
| 7 | Pennsylvania | 20,568 | 3.1% |
| 8 | North Carolina | 20,395 | 3.1% |
| 9 | Washington | 18,039 | 2.7% |
| 10 | Missouri | 17,496 | 2.7% |
Source: NICB 2025 Year-End data. Share of total calculated by ShadowGPS from the 659,880 national figure.
States with the lowest car theft rates
Northern New England and the Mountain West remain the safest places to park. The five lowest theft rates in 2025:
- New Hampshire: 40.3 per 100,000 (567 thefts)
- Idaho: 53.9 per 100,000 (1,078 thefts)
- Maine: 60.6 per 100,000 (853 thefts)
- Wyoming: 73.3 per 100,000 (430 thefts)
- West Virginia: 82.0 per 100,000 (1,450 thefts)
Low isn't zero. Wyoming still lost 430 vehicles last year, and in rural states a stolen truck can be hundreds of miles away before anyone notices it's gone. Distance cuts both ways.
Car theft hot spots: the metro areas to watch
Theft concentrates in big metros, so your city often matters more than your state. Here are the 10 metro areas with the most thefts in the first half of 2026.
| Rank | Metro area | H1 2026 thefts | Change vs. H1 2025 |
|---|---|---|---|
| 1 | Los Angeles-Long Beach-Anaheim, CA | 21,540 | -23% |
| 2 | Chicago-Naperville-Elgin, IL-IN | 11,761 | +2% |
| 3 | New York-Newark-Jersey City, NY-NJ | 11,306 | -16% |
| 4 | Houston-Pasadena-The Woodlands, TX | 10,008 | -18% |
| 5 | San Francisco-Oakland-Fremont, CA | 9,825 | -14% |
| 6 | Dallas-Fort Worth-Arlington, TX | 8,212 | -30% |
| 7 | Philadelphia-Camden-Wilmington, PA-NJ-DE-MD | 8,056 | -11% |
| 8 | Riverside-San Bernardino-Ontario, CA | 5,937 | -20% |
| 9 | Washington-Arlington-Alexandria, DC-VA-MD-WV | 5,717 | -31% |
| 10 | Seattle-Tacoma-Bellevue, WA | 4,834 | -27% |
Source: NICB first-half 2026 release. Metro areas are Core-Based Statistical Areas (CBSAs).
Highest rate, not just volume: Bakersfield-Delano, California, had the highest metro theft rate in the country in early 2026, at 223.28 per 100,000 for the six-month period. That's nearly triple the national six-month rate of 77.81.
Washington, D.C.: The nation's capital cut thefts by 52% in early 2026, yet still had the highest rate of any state-level jurisdiction at 181.94 per 100,000 for those six months. A big drop from a very high level still leaves you well above average.
Also note the two "slow decliner" states from earlier showing up here: New Jersey (in the New York and Philadelphia metros) and Pennsylvania (Philadelphia). The metro data and the state data tell the same story.
Most stolen vehicles in 2025
What you drive changes your odds as much as where you live. These were the ten most stolen models nationwide in 2025.
| Rank | Make and model | Type | 2025 thefts |
|---|---|---|---|
| 1 | Hyundai Elantra | Sedan | 21,732 |
| 2 | Honda Accord | Sedan | 17,797 |
| 3 | Hyundai Sonata | Sedan | 17,687 |
| 4 | Chevrolet Silverado 1500 | Pickup truck | 16,764 |
| 5 | Honda Civic | Sedan | 12,725 |
| 6 | Kia Optima | Sedan | 11,521 |
| 7 | Ford F-150 | Pickup truck | 10,102 |
| 8 | Toyota Camry | Sedan | 9,833 |
| 9 | Honda CR-V | Crossover | 9,809 |
| 10 | Nissan Altima | Sedan | 8,445 |
Source: NICB 2025 Year-End National Vehicle Thefts.
Two things stand out. Older Hyundai and Kia models without engine immobilizers still dominate, though their share of all thefts has dropped every year since 2023. And full-size pickups are the only American models in the top 10, which matters if you rely on a work truck. For the full breakdown by model, see our guide to the most stolen vehicles of 2025.
When and where cars get stolen
Patterns in NICB's incident data are remarkably consistent year to year:
- Night is peak time. The single busiest hour for thefts is midnight to 1 a.m., and evening hours from 8 to 11 p.m. run well above the daytime average.
- Streets beat driveways. More than half of all thefts happen on roads, streets, and sidewalks, with parking lots and garages next.
- Opportunity drives a lot of it. NICB's own prevention tips focus on unlocked doors, keys left inside, and cars left running, because those are still common ways cars disappear.
Overnight street parking in a high-rate metro is the highest-risk combination in the data. If that describes your setup, it's worth a closer look at the geofence alerts that catch overnight theft.
Your state's rate is not your car's risk: a 4-layer framework
State rankings are a starting point. To understand your actual exposure, stack four layers. Each one can raise or lower your risk more than your state's rank does.
Layer 1: State
Find your state in the 50-state table. Note both the rate and the change. A High-tier state with a slow decline (Illinois, Alaska) deserves more caution than a High-tier state falling 35% (Colorado).
Layer 2: Metro
Big metros concentrate theft. A driver in Los Angeles, Chicago, Houston, or Philadelphia faces a different reality than someone in a small town in the same state.
Layer 3: Model
Driving a pre-2022 Kia, a pre-2023 Hyundai, a Honda sedan, or a full-size pickup puts you in the most-targeted group, even in a Low-tier state.
Layer 4: Habits and parking
Overnight street parking, keys left in the car, and long stretches where nobody checks on it (a Turo car between trips, a work truck over the weekend) raise risk everywhere.
Example: two owners, same state
Maria lives in a quiet Pennsylvania suburb, parks a 2024 SUV in a locked garage, and drives it daily. Her real risk is low, even though Pennsylvania is a "slow decliner."
Dev runs three Turo cars in Philadelphia, including a 2019 Elantra, parked on the street between bookings. Same state, but he hits all four layers: slow-declining state, top-10 metro, most-stolen model, and unattended street parking. Dev needs a plan. Maria mostly needs good habits.
What these numbers mean for you
The stats land differently depending on whose car it is. Here's how to read them for the three situations we hear about most.
Parents of teen drivers
Teens park in school lots, at friends' houses, and on streets you don't know. In a High-tier state, being able to see where the car is (and get an alert if it moves when it shouldn't) turns a panicked phone call into a calm check of your phone. More in our guide on teen drivers and elderly parents.
Family car or truck owners
If you drive a top-10 model or park overnight on the street in a big metro, your risk is above your state's average. Layer free habits with one tool that helps you find your car if the habits fail.
Turo hosts and small fleets
Cars that sit unattended between trips or over weekends are the hardest to watch. With 2 to 5+ vehicles, knowing where each one is, all the time, is basic asset protection. See how hosts set this up on our Turo page.
How to protect your car in a high-theft state
NICB and the National Highway Traffic Safety Administration both recommend a layered approach: make your car harder to take, and easier to find if someone takes it anyway. Here's how that works in practice.
Free habits that work
- Lock up and roll up. Thieves still walk lots testing door handles. Lock every time, and close every window.
- Keys stay with you. Never leave a key or fob inside, even for a quick stop, and never leave your car running unattended.
- Park in the light. Choose well-lit spots, near streetlights or entrances, and use your garage if you have one.
- Hide the bait. Bags, electronics, and garage door openers invite break-ins that can turn into thefts.
- Check your recalls. If you drive an older Hyundai or Kia, make sure the free anti-theft software update has been applied at a dealer.
Anti-theft tools compared
Habits lower the odds. Tools cover what habits can't. Each tool below solves a different part of the problem, and the best setups combine a deterrent with a way to find your car.
| Tool | Deters theft? | Helps you find your car? | How you know | Ongoing cost |
|---|---|---|---|---|
| Steering wheel lock | Yes, visibly | No | You don't, until you return | None |
| Factory or aftermarket alarm | Somewhat | No | Only if you hear it | None |
| Kill switch or immobilizer | Yes | No | You don't | None after setup |
| Bluetooth tag (e.g. Apple AirTag) | No | Sometimes, if Apple devices pass nearby | Location pings, not live | None |
| ShadowAuto GPS tracker | Yes, with Car Alarm alerts | Yes, live on your phone | Instant phone alerts and live map | Monthly fee, no contract |
ShadowGPS sells ShadowAuto. AirTag and similar tags are designed for items, not vehicles, and rely on nearby phones to report location.
Why a GPS tracker is the layer that helps after a theft
Locks, alarms, and kill switches all work before a theft. None of them help once your car is gone. A real-time GPS tracker is the one layer that keeps working after the worst happens, because it tells you where your car is right now, not where it was an hour ago.
That matters most in the states at the top of our table, where cars can leave the metro quickly. It's also why NICB lists aftermarket GPS tracking among its recommended anti-theft tools. For the deeper case, including how police use tracker data, see our real stats on GPS trackers vs car theft and how trackers help police.
ShadowAuto is built for exactly this job. You plug it into your car's OBD-II port in under two minutes, with no tools and no appointment. Then you open the app and see your car on a live map, with Car Alarm, tamper alerts, and geofence alerts that tell you the moment something is off.
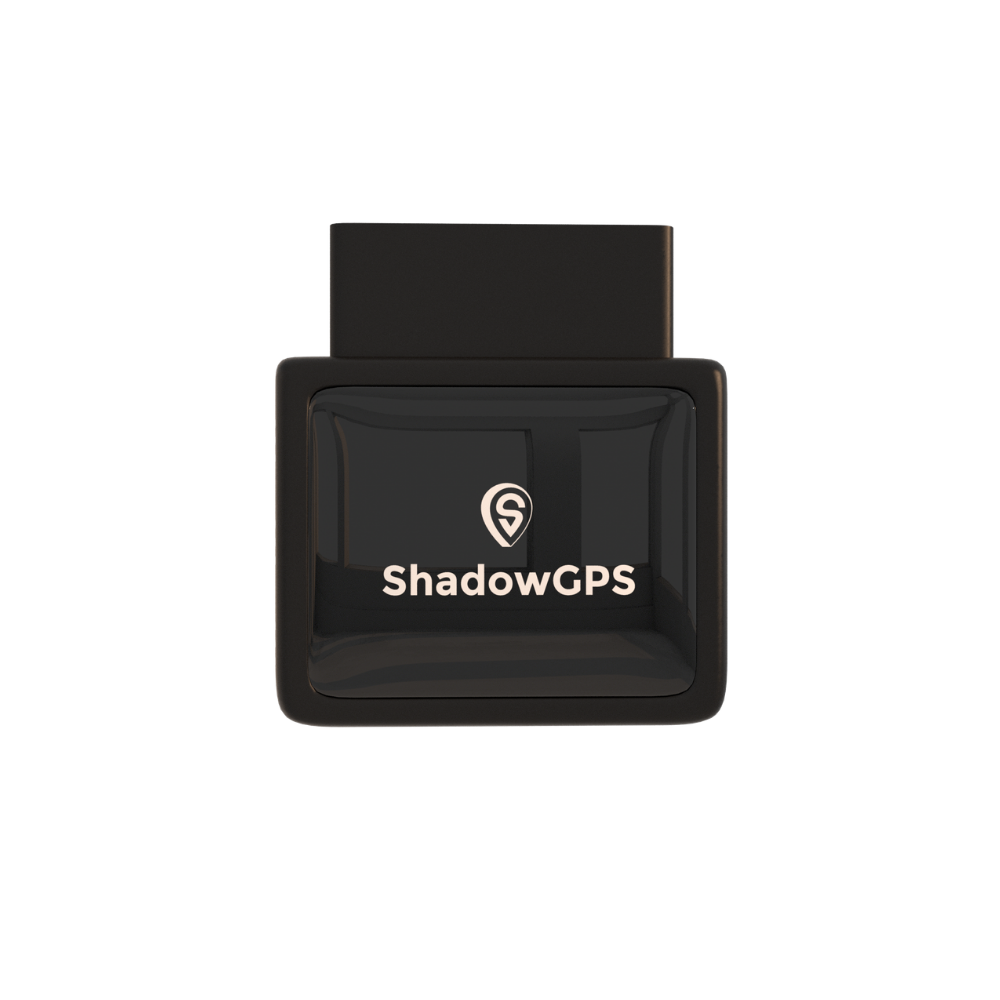
ShadowAuto
- Live location that updates every 5 seconds while moving
- Plug it in under 2 minutes, powered by your car
- Car Alarm, tamper and geofence alerts on your phone


Running trailers, equipment, or a vehicle without an OBD-II port? That's where ShadowTrack fits. It's battery-powered, sits in a weatherproof magnetic case, and goes anywhere you can stick or tuck it, which makes it a good match for small fleets protecting more than just cars.
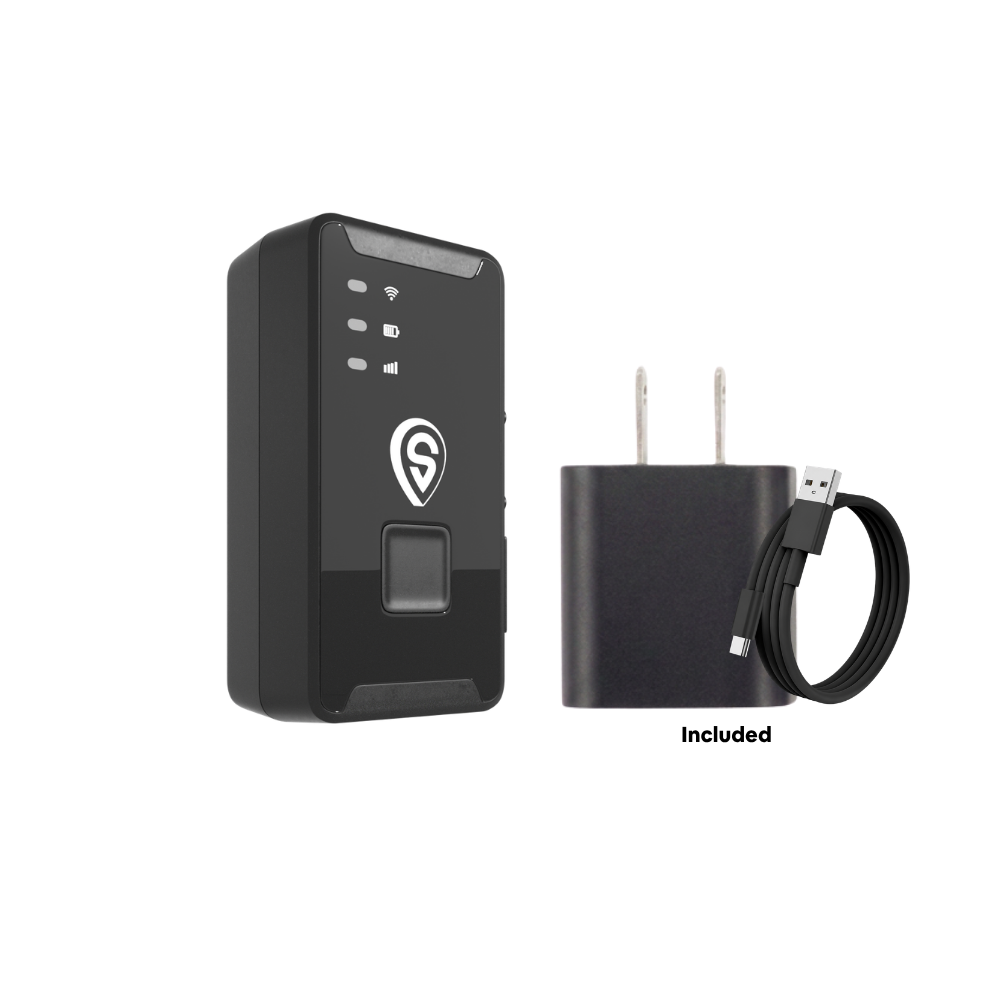
ShadowTrack
- Weatherproof magnetic case, mounts in seconds
- About 15 days per charge, rechargeable
- Same app, live map and trip replay as ShadowAuto
Best for: ShadowAuto for your everyday car, your teen's car, or a Turo car. ShadowTrack for trailers, equipment, and anything without an OBD-II port. Comparing options first? Our roundup of the best GPS trackers for cars covers the field.
If your car is stolen: the first hour
Speed matters. Recovery data analyzed by ValuePenguin shows about a third of recovered stolen vehicles are found the same day, and close to half within two days. Here's what to do right away:
- Confirm it wasn't towed. Call the local tow line or check your city's towed-vehicle lookup.
- Call 911 or the police non-emergency line. Have your plate, VIN, make, model, and color ready. Ask for a report number.
- Check your tracker. If you have one, share its live location with officers. Never try to recover your car yourself.
- Call your insurer. Theft is generally covered only if you carry comprehensive coverage.
- Tell your lender or lessor, and for a Turo car, notify Turo through the host app.
Our step-by-step recovery guide walks through each step in more detail.
How we built this data
We want you to trust these numbers, so here's exactly where they come from and what they can and can't tell you.
- Primary source: The National Insurance Crime Bureau's 2025 year-end vehicle theft data (released March 2026) and its first-half 2026 analysis (released September 30, 2026). NICB draws on stolen-vehicle records reported to the FBI's National Crime Information Center.
- Rates: Full-year state rates use 2025 Census Bureau population estimates. Six-month rates are labeled as such. Don't compare a six-month rate with an annual one; the six-month number will always look roughly half as big.
- Why other sites show different numbers: Some use the FBI's Crime Data Explorer, which depends on which local agencies submit data, or rank states per registered vehicle instead of per resident. Both are valid; they just answer slightly different questions.
- What we added: The risk tiers, the "points worse than national" comparison, share-of-total figures, and the 4-layer framework are ShadowGPS analysis built on NICB's figures.
- Next update: We'll refresh this page when NICB publishes full-year 2026 state data, typically in spring.
Frequently asked questions
Which state has the highest car theft rate?
California had the highest car theft rate in 2025 at 348 thefts per 100,000 residents, followed by Nevada and New Mexico (both 318.3). California also had the most thefts by volume, with 136,988. Among all jurisdictions, Washington, D.C. had the highest rate in the first half of 2026.
Which state has the lowest car theft rate?
New Hampshire had the lowest rate in 2025 at 40.3 thefts per 100,000 residents, followed by Idaho (53.9), Maine (60.6), Wyoming (73.3), and West Virginia (82.0).
Is car theft going up or down in 2026?
Down. NICB reported 268,415 thefts in the first half of 2026, a 21% drop from the same period of 2025, and every state declined. This follows a 23% drop in 2025 and a 17% drop in 2024.
Where is car theft rising?
Alaska was the only state where thefts rose in 2025 (up 7%). In the first half of 2026, no state rose, but the Chicago-Naperville-Elgin metro area increased 2%, the only top-10 metro to go up. Pennsylvania (down just 4% in 2025) and New Jersey (down 7%) improved far slower than the 23% national decline.
How often is a car stolen in the US?
About once every 48 seconds in 2025, based on 659,880 thefts for the year. In the first half of 2026 the pace slowed to roughly one theft per minute.
What is the most stolen car in America?
The Hyundai Elantra, with 21,732 thefts in 2025, followed by the Honda Accord and Hyundai Sonata. The Chevrolet Silverado 1500 was the most stolen pickup truck.
What city has the most car thefts?
The Los Angeles-Long Beach-Anaheim metro area, with 21,540 thefts in the first half of 2026. By rate, Bakersfield-Delano, California, ranked highest at 223.28 per 100,000 for that six-month period.
Does a GPS tracker help recover a stolen car?
Yes. A real-time GPS tracker shows police where your car is right now, which is why NICB lists aftermarket GPS tracking among its recommended anti-theft tools. Always let law enforcement handle the recovery.
Is there a monthly fee for a GPS tracker?
Real-time cellular trackers need a data plan. ShadowGPS plans run $9 to $15 a month for 1 to 3 trackers, with no contract. Month-to-month, or prepay and save. Full details are on our pricing page.
Does a GPS tracker need a SIM card?
Not one you have to buy. ShadowAuto and ShadowTrack come with cellular connectivity built in and covered by your plan, so you just plug it in or mount it and open the app.
The numbers are falling. Your peace of mind shouldn't depend on them.
Whatever your state's rank, you can know where your car or truck is, any time. Plug it in, see it move, cancel any time. No contract, ever. See plans and pricing.
Data current as of October 2026: NICB 2025 year-end state data and NICB first-half 2026 release (September 30, 2026). Pricing current as of October 2026. Some links on this page are affiliate links; we may earn a commission at no extra cost to you. ShadowGPS sells ShadowAuto and ShadowTrack. Always contact law enforcement to recover a stolen vehicle and never attempt recovery yourself.

